Our comprehensive college dropout prediction model is grounded in a robust theoretical framework that integrates insights from various fields of study.
Given the predominance of empirical studies of dropout based on traditional variables that generally do not incorporate non-cognitive, psychological, social and integration factors in the development of predictive models, at Adaptiva® we have developed a predictive model of college dropout that adds factors such as motivation, commitment and engagement to the academic community to the sociodemographic and cognitive variables.
Figure 1
Type of factors considered in the predictive model
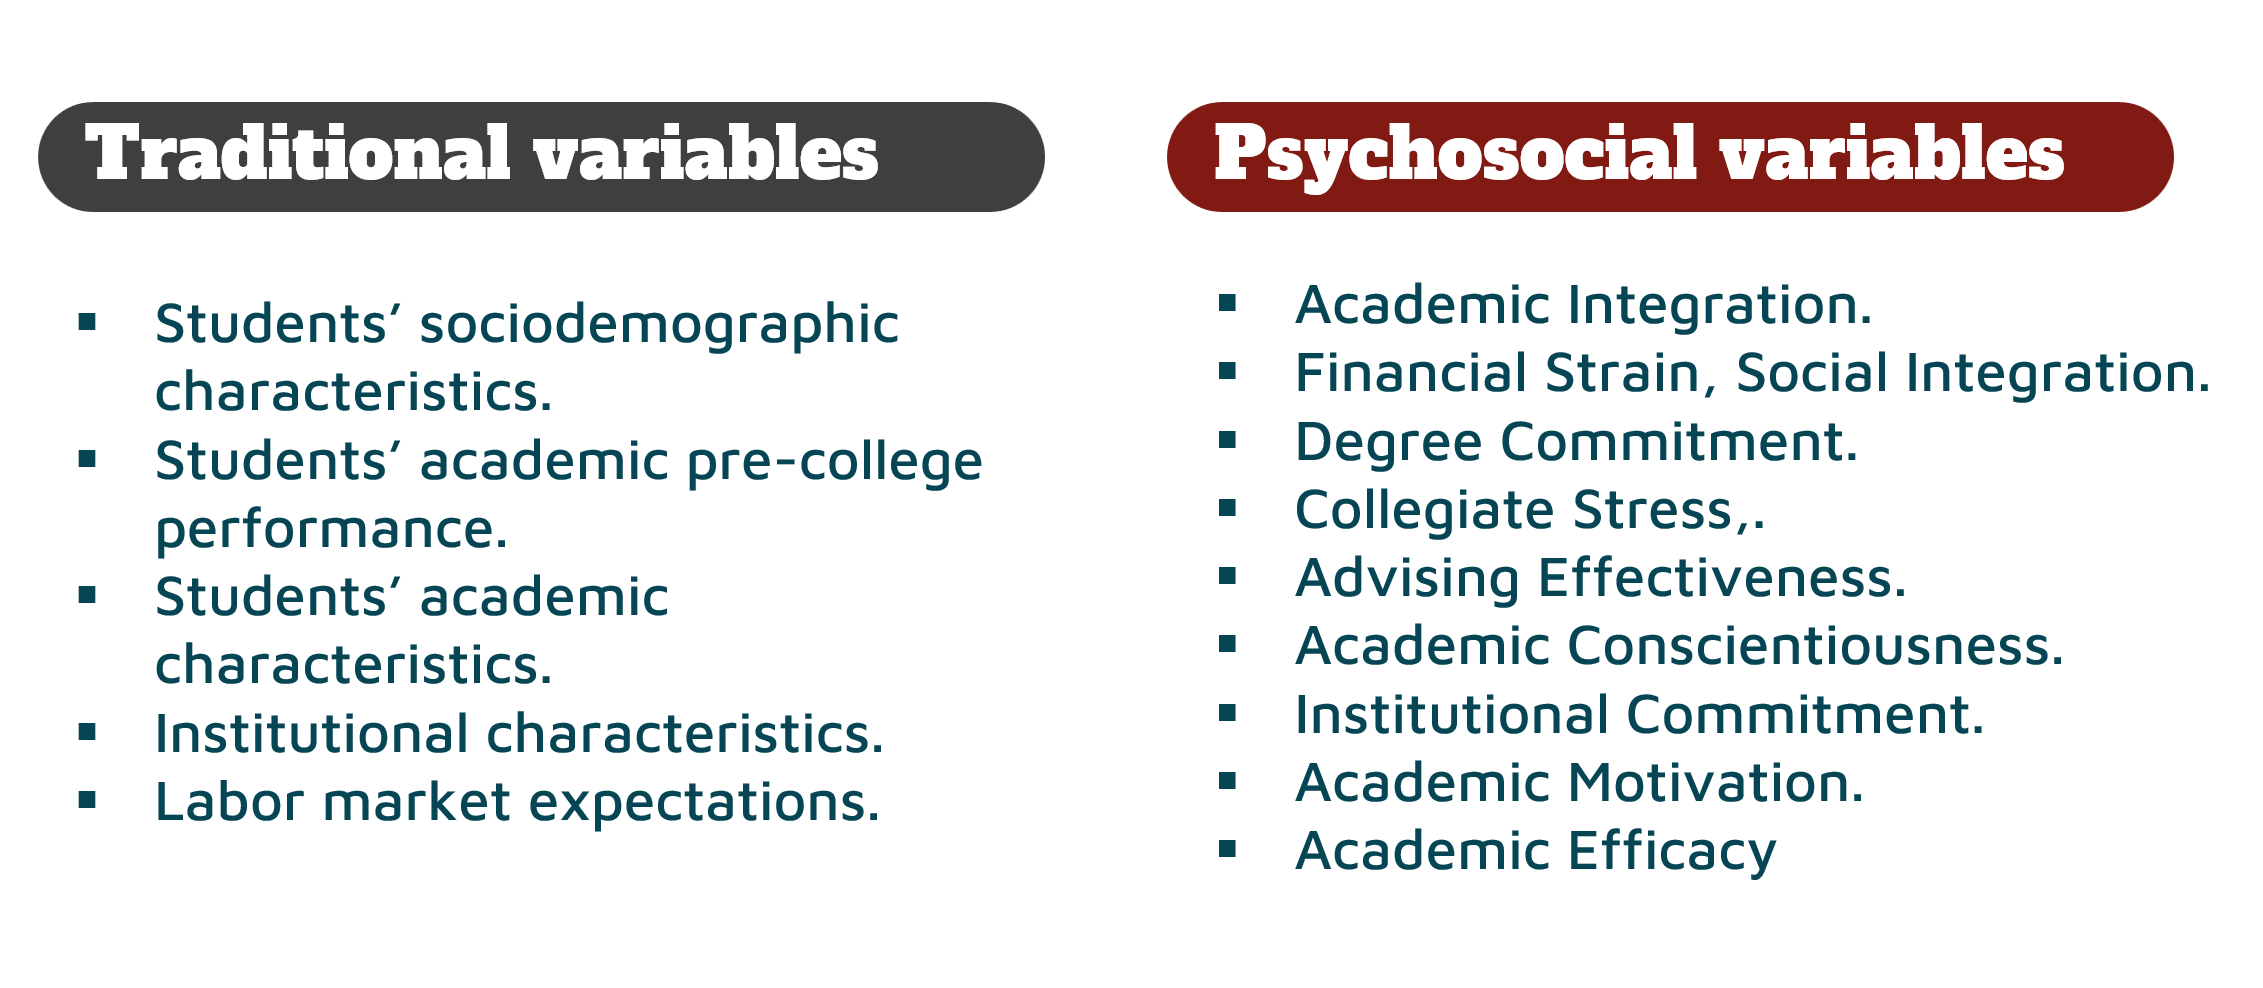
Note. Own elaboration.
The variables considered in the ADAPTIVA® college dropout prediction model are divided into two categories: traditional variables and psychosocial, integration variables. Traditional variables, on the one hand, such as socio-demographic characteristics of students, pre-university performance, academic characteristics and institutional characteristics are usually stored in institutional databases. The psychosocial and integration variables, on the other hand, correspond to 10 dimensions of a psychometric instrument developed to collect students’ psychosocial perceptions and adjustments to college life. Persistence is determined from enrollment data. Students who persist are labeled as persistent, and those who do not return are labeled as dropout. This dichotomous data informs the dependent variable for the ADAPTIVA® model.
Figure 2
Sources of predictive model

Note. Own elaboration.
The data collection and analysis process followed the Educational Knowledge Discovery and Data Mining (EKDD) guidelines proposed by Romero & Ventura (2013). Traditional, demographic and academic performance information was obtained from the university’s Student Information System (SIS) and the Ministry of Education. The psychosocial variables correspond to the 10 dimensions of the psychometric instrument. After a data preprocessing process, including the discretization of numerical variables, the binarization of discrete variables, the normalization and standardization of numerical variables, the imputation of missing data, as well as the balancing of the response variable due to the imbalance between the cases of persistence and dropout, a series of classification algorithms are applied to determine the one that best predicts the cases of dropout, including Logistic Regression, Random Trees, C4.5, Random Forest, Naïves Bayes, BayesNet, Support Vector Machines, k-nearest neighbors, and Neural Networks algorithms. By ‘best algorithm’ is meant the classification algorithm that showed the best performance in the classification task according to the indicated metrics, and that is also understandable, computationally efficient, and simple to implement by administrators.
Figure 3
Overview of steps comprising the KDD process

Note. Own elaboration based on Fayyad et al., 1996.